Dr. Alex Harrison Parker

Research scientist in planetary astronomy at the Southwest Research Institute, supporting NASA's New Horizons mission to Pluto, and developing the post-Pluto mission into the Kuiper Belt. Expert in the dynamics of binary minor planets, detection and characterization of trans-Neptunian objects, and the origin of the architecture of our Solar System.

Trans-Neptunian Space and the Post-Pluto Paradigm

In 2019 and early 2020, I wrote a review chapter to appear in The Pluto System After New Horizons book. After some COVID-related delays, the book is now published and I can share the manuscript.

In my chapter, “Trans-Neptunian Space and the Post Pluto Paradigm,” I reviewed what the flyby of Pluto and its satellites revealed about the vast populations of minor planets beyond Neptune. There was a lot of ground to cover, so here are some of the highlights.

New estimates of the size-frequency distribution of TNOs from 0.1 km to 1000 km.

A size-frequency distribution describes how a population is portioned into different sizes. For TNOs, large objects are much rarer than smaller objects. The properties of the size-frequency distribution of a population of minor planets can provide important insights into the origin of that population and to the processes that have driven its evolution over the age of the solar system.

For us Earth-bound observers, TNOs are distant and faint. Direct detection surveys from ground- and space-based telescopes have done a good job of characterizing the size-frequency distribution of TNOs down to diameters of a few tens of kilometers. Searches for serendipitous stellar occultations have turned up a handful of candidate events consistent with occultations by small (~1 km) TNOs, but by far the richest dataset we have to constrain what is happening at small sizes is the crater records of Pluto and Charon.

I created a forward-modeling framework to simulate crater records on Pluto and Charon given a proposed population of impacting TNOs, and used a likelihood-free inference framework to determine the properties of that impacting population. By drawing priors for the population’s model parameters from past direct-detection surveys, I was able to merge what is known from those surveys and from the crater records. The result is a model of the size-frequency distribution of TNOs ranging in size from 0.1 km to 1000 km. This analysis is discussed in section 2.1

The cumulative size-frequency distribution of TNO populations that interact with the Pluto-Charon system, merging crater information and direct-detection information.

The cumulative size-frequency distribution of TNO populations that interact with the Pluto-Charon system, merging crater information and direct-detection information.

Inferred parameters for the small-object and mid-size object slopes of the size-frequency distribution of TNOs.

Inferred parameters for the small-object and mid-size object slopes of the size-frequency distribution of TNOs.

Evidence for binary impactors in the Pluto and Charon crater records.

Craters on Pluto and Charon tend to have nearby neighbors of similar size — more so than you would expect from an integrated history of solitary impactors. Using a model that tracks terrain-based selection effects, I was able to show that a binary-hosting impactor population is preferred. This indicates that small TNOs — much smaller than we have ever observed from Earth — often host close binary companions. This analysis is discussed in section 2.2.

How many moon-forming events did large TNOs experience?

Moons are ubiquitous among the largest TNOs, but the properties of those moons vary wildly. Pluto’s complex system of satellites — one giant inner binary with four tightly-packed small satellites outside — appears to stand out as unusual even given the range of oddities of other systems.

Most moon-forming hypotheses rely on stochastic one-off events — a massive collision generates a huge disk of material that re-accretes into one or more satellites, for example. However, if the probability of one of those stochastic moon-forming events happening is independent on whether or not another one has already happened, then the ubiquity of satellites around the largest TNOs demands that some of these moon systems must be the outcome of a series of moon-forming events. Perhaps, then, the unusual properties of Pluto (or other complex systems, like Haumea, its two satellites, ring, and collision family) can be better understood in the context of a chain of moderately improbable events rather than the outcome of a single very improbable one. This discussion can be found in section 3.

Where else will we see active geology?

Pluto’s surface revealed that it is a geologically active world, with a complex volatile transport cycle, ongoing convection of a giant nitrogen ice sheet, potential signs of cryovolcanism, and other active processes. Some of the other large TNOs are likely to exhibit similar active processes on their surfaces. Size, composition, distance from the sun and pole orientation all factor into the likelihood of encountering active processes on the other large TNOs. Sputnik Planitia-like convecting nitrogen ice sheets might be found on Eris today, if heat from its mantle can conduct efficiently to the surface. Consideration of potential sites of active geologic processes throughout trans-Neptunian space is discussed in section 4.1—4.2.

How many Dwarf Planets host internal oceans?

Interior structure of Eris derived from a thermophysical model of its evolution over the age of the solar system, showing potential for an extant liquid interior ocean.

Interior structure of Eris derived from a thermophysical model of its evolution over the age of the solar system, showing potential for an extant liquid interior ocean.

A variety of signs on Pluto and Charon indicate that they both hosted liquid internal oceans in their past, and Pluto’s may survive to this day. The long-lived internal oceans of Pluto-like dwarf planets, in direct contact with the rocky cores of the dwarf planets, could be sites for the emergence of life. Which other dwarf planets are candidates for hosting extant liquid water in their interiors? Thermophysical modeling of Eris and Makemake suggest that these worlds could still host liquid water layers, but there is much still to learn about the material properties of the interiors of these worlds that could make oceans much more or much less likely. This modeling is discussed in section 4.3.


Review chapter, “Trans-Neptunian Space and the Post-Pluto Paradigm” pre-proof manuscript. PDF, 4MB, 29 pages.


Titan and Saturn Moving Through a Technicolor Sky

Back in December of 2016, NASA’s Kepler Space Telescope observed Titan and Saturn moving through its field of view. Over 3.7 days, Kepler watched the system, unblinking, imaging nearly constantly with 30 minute exposures for the entire time.

Compared to most of the targets that Kepler was designed to observe, Saturn and Titan are both pretty bright. Because of this, they saturated the pixels of the camera that they fell on, resulting in bleeding of the charge accumulated by those pixels into their neighbors.

A small team (Sarah Horst, Erin Ryan, and Carly Howett) and I took this data set and endeavored to dig Titan out of the glare of Saturn. No one had observed Titan with this kind of observatory on this kind of timeline before, and we could learn new things about the dynamics of Titan’s extremely complex atmosphere by seeing how much its reflectivity changed over time. We had to invent some new techniques to do this, and they are the subject of a paper we have submitted for peer review.

As part of this process, we had to break down each black-and-white image into where we thought each detected photon came from. Did this one come from Titan, Saturn, the empty sky, or a background star? The methods we put together let us do this surprisingly accurately (we were able to measure Titan’s brightness to a precision of 0.19%, even though up to 60% of the photons striking the camera at Titan’s location actually came from Saturn).

With this kind of photon-tagging, we could now colorize the images depending on where each photon came from. We colored saturated pixels white — they are just blown out and kind of a mess. Unsaturated counts that we ascribe to Titan we color yellow, Saturn we color magenta, and the background stars we color cyan. We mix these layers and produce a false color image highlighting these three components.

This is the result:

Image credit: NASA / A. Parker, 2019.

Image credit: NASA / A. Parker, 2019.

The images show the slice of sky that the Kepler K2 team recorded in anticipation that Titan and Saturn would move through them. The strip seems to wobble slightly because we have added a slight correction to each frame to track the motion of the spacecraft. Toward the end of the animation, Enceladus peaks out of the saturated light around Saturn for a few frames.

I will post further updates as the status of our submitted paper progresses.

Predicting citation rates for arXiv astrophysics papers

I have been looking for an excuse to try out the Python Natural Language Toolkit, and thought that it would be most useful if I applied it to something close to home. Inspired by the recent brilliance that is @OverheardOnAph, I decided I would look at the same corpus of text (the astrophysics arXiv), but with a different goal in mind. Instead of parsing the raw LaTeX files for comments that the authors probably intended to remove before publishing, I asked: are there any features of a paper's abstract that predict how well it will be cited down the road? 

I found some very intriguing results:

  • Papers with long, non-repetitive abstracts are substantially more likely to be well-cited than papers with short or repetitive abstracts.
  • Each additional five unique words increments the median citations after five years by one.
  • Papers submitted to the general astro-ph are the most cited, followed by astro-ph.CO, astro-ph.GA, astro-ph.HE, astro-ph.SR, astro-ph.EP, and astro-ph.IM.
  • After controlling for length and sub-arxiv, papers with abstracts written mostly in passive voice are penalized slightly relative to papers with abstracts written mostly in active voice.
  • For some sub-arXivs, there are individual words that appear significantly more often in well-cited papers' abstracts than poorly-cited ones. These words are:
    • In astro-ph.HE:
      • "100"
      • "GeV"
    • In astro-ph.EP:
      • "star"
    • In the general astro-ph:
      • "abridged" (further evidence that longer abstracts are better cited)
      • "galaxy" or "galaxies"
      • "lcdm"
      • "massive"
      • "scale"
  • No individual words were found that predicted poor citation rates.

Read on for details!


The sample

 I collected 4,575 abstracts of astrophysics papers published in 2009 using the arXiv API, and used their DOI or arXiv ID to locate their associated NASA ADS page, which I then parsed using BeautifulSoup to extract their current citation count (citations after 5 years).

I only extracted the abstracts of papers that included journal references. This is a fairly small fraction of the total number of papers, but it allowed me to ensure that the articles were (a) published in a journal and (b) published in 2009.

I retained each paper's citation count, raw abstract text, and the primary arXiv category the paper was listed under (astro-ph, astro-ph.CO, astro-ph.EP, etc.)

Text analysis

I checked a number of properties of abstracts for correlations with citation rate. When searching for correlations, I was most interested in how the median citation rate varied with the properties under consideration. For initial inspection, I usually broke up the sample into N groups with equal population, sorted on the property of interest, and compared the median citation rates of each of these groups. I estimated the uncertainty in these medians due to finite sample size by a simple bootstrap analysis; resampling with replacement the citation counts in each group and calculating a large sample of medians that "might have been," then determining the confidence interval on the true median from the distribution of medians within this sample.

Using this approach, I found no obvious trends with reading level (using either SMOG grade or Flesch–Kincaid Grade Level) or fraction of text written in passive voice (the passive-voice heuristic I developed is incorporated in my open-source NLTK Jargon package).

I did, however, find one property that strongly correlated with median citation rate: abstract length. The strongest correlation I identified was between citation count and the total number of unique word roots in an abstract. 

Papers with long, detailed abstracts are substantially better-cited than papers with short abstracts

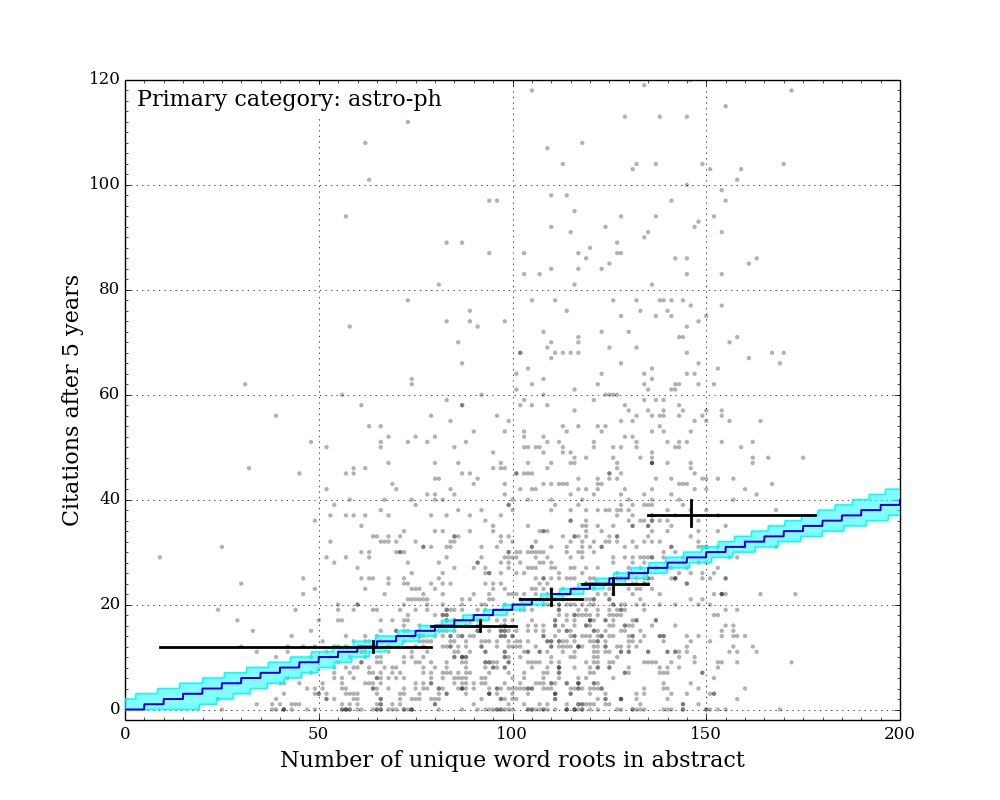
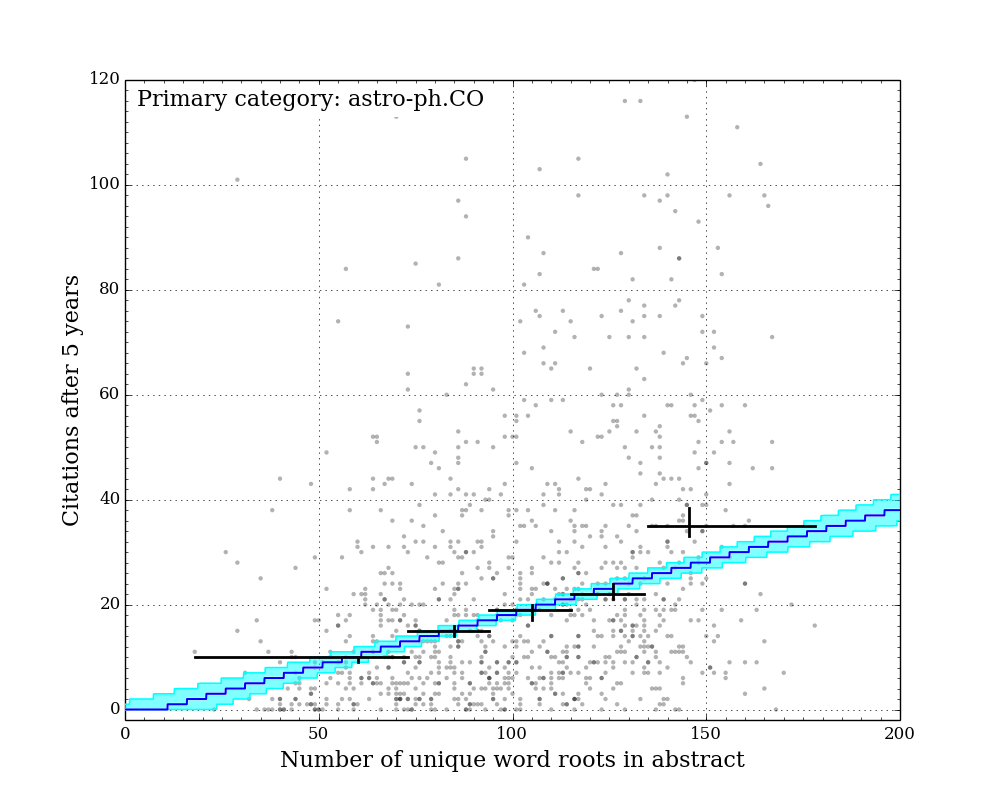
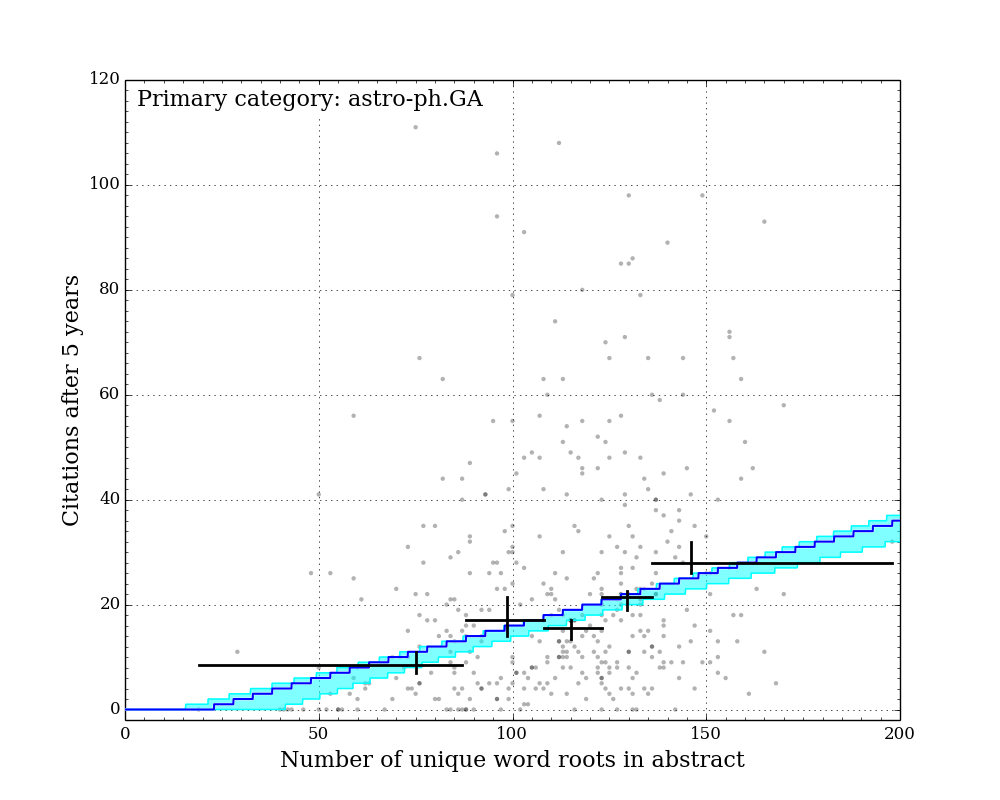
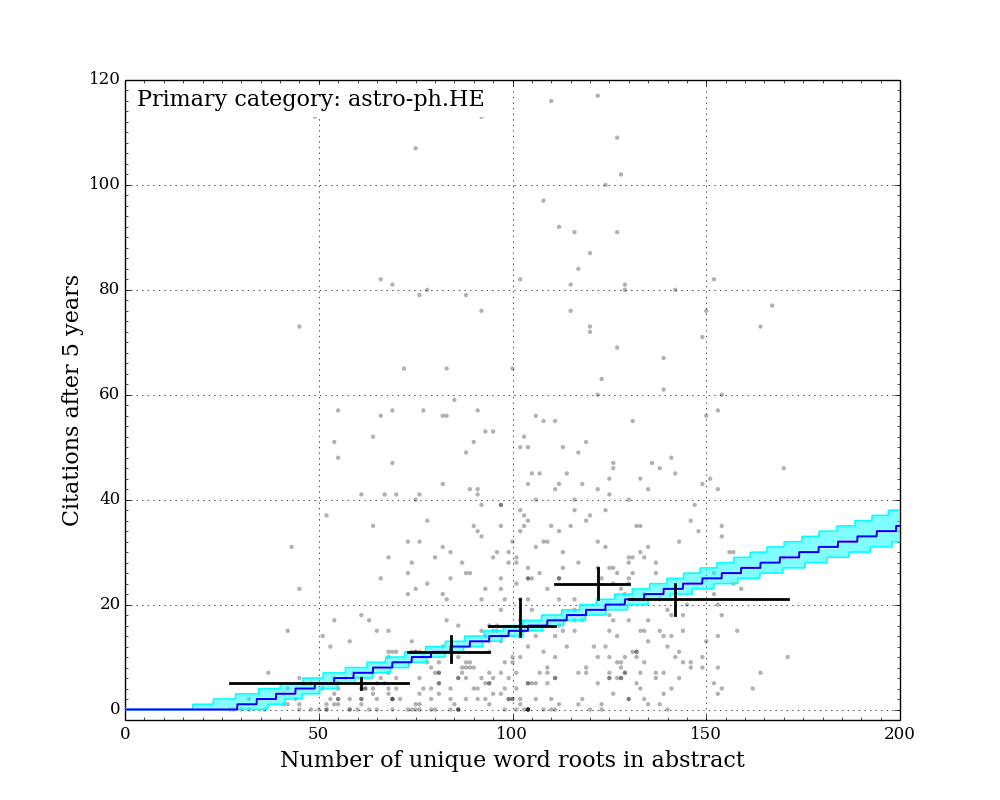
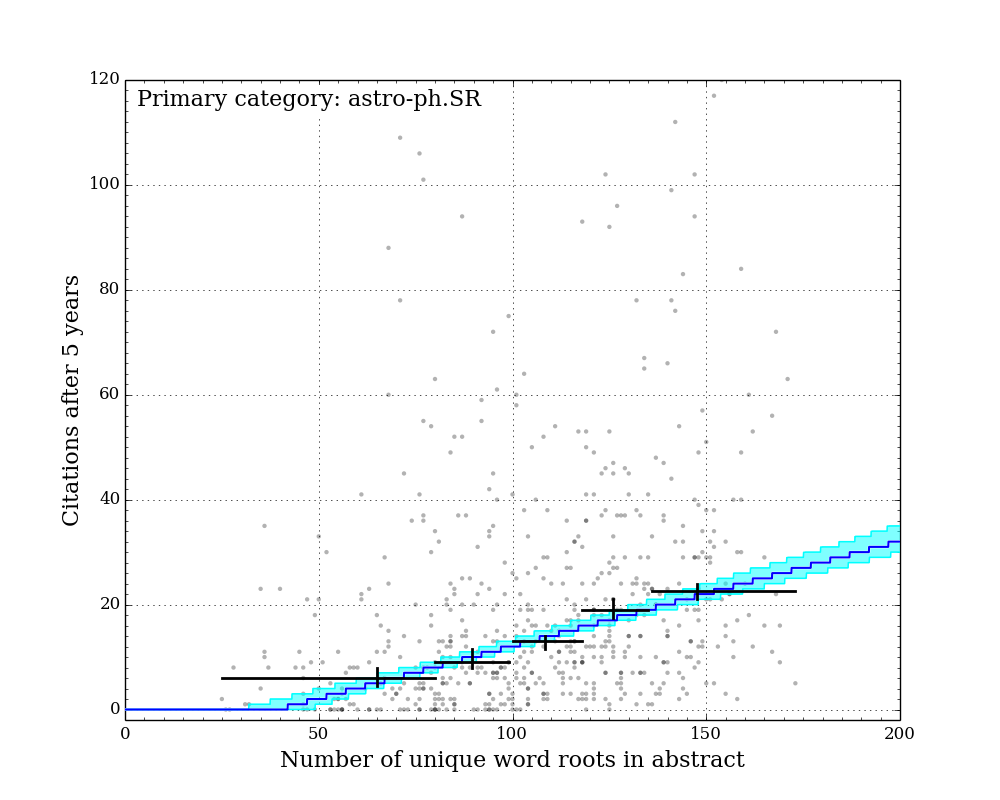
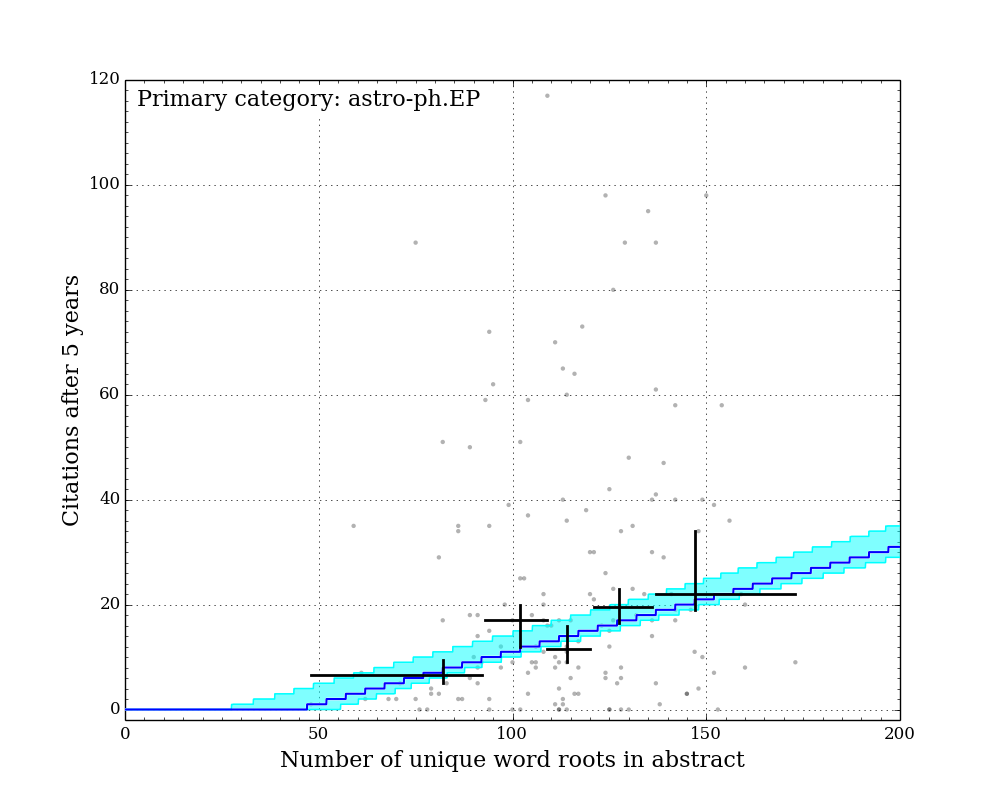
Figure Gallery 1: Citations after 5 years vs. number of unique word roots. 7 sub-arxivs illustrated separately. Black crosses: equal-population grouped medians with 1-sigma sampling uncertainty illustrated by vertical lines. Blue line: best-fit "linear median" model with constant slope across all sub-arxivs. Cyan region: 1-sigma credible region of "linear median" model. 


The figures above show the citations after five years vs. the number of unique word roots in each paper abstract. I split the papers into their primary sub-arxiv for these figures. Overlaid on the points are 5 grouped medians (black crosses), each representing equal populations sorted on number of unique word roots. The horizontal bars illustrate the range covered by each population, and the vertical error bars illustrate the 1-sigma uncertainty on the medians determined by the bootstrap resampling described earlier. 

Qualitatively, it is clear that for all categories, the median citation rate climbs as the number of unique words in the abstract increases. In order to better quantify this, I adopted a linear model for the expected median citation rate as a function of number of unique word roots. Below where this model intersects zero, the model citation rate is set to zero.

Because some sub-arxivs are poorly represented in my sample, I decided to fix the slope of this model across all sub-arxivs, while allowing the constant factor to vary for each sub-arxiv. This effectively implies an assumption that while there may be fewer citations to a paper in a given sub-arxiv, the addition of more unique word roots (or more information) is equally valued across all sub-arxivs.

Since there are an infinite number of lines that bisect a given 2D distribution exactly in half, the definition of a formal "linear median trendline" is subtle. Because both quantities under consideration here are discretized, it is possible to construct a relatively simple and formally meaningful median trendline definition that does not rely on any additional binning of the data. I hope to describe this median trendline definition in a future post. Note that the grouped medians illustrated by the black crosses in the figures above do not have any influence on the model, and yet they generally agree very well with the model (except for astro-ph.IM, which is an outlier in a number of ways...).

I determined the uncertainties on the linear median model parameters (one slope M and seven intercepts {b1 ... b7}) with a bootstrap-resampling approach: I resample with replacement from the abstracts' citations and length in each sub-arxiv, re-fit the "linear median trendline" model to the resampled data, and repeat this process many times. The posterior distribution of the parameters of the model are estimated from the distribution of the models fit to the resampled data.

The best-fit slope and its 1-sigma uncertainty across all sub-arxivs is 0.20 (+0.03/-0.02). This indicates that for abstracts longer than some minimum length, each five additional unique word roots adds roughly one citation to the expected median citations after five years.

Using the constant terms of the linear median models, I ranked the absolute citation offsets between sub-arxivs. These offsets represent the median difference in citations accumulated after 5 years for two papers with otherwise identical abstract properties. The offsets are normalized to the general astro-ph repository, which has the highest median citation rate.

sub-arxiv Model median citation offset (uncertainty)
astro-ph 0.0 (+0.0/-0.0) citations
astro-ph.CO -1.2 (+1.3/-1.0) citations
astro-ph.GA -3.6 (+0.4/-2.2) citations
astro-ph.HE -4.8 (+1.6/-0.9) citations
astro-ph.SR -7.4 (+1.4/-0.8) citations
astro-ph.EP -8.4 (+3.4/-1.2) citations
astro-ph.IM -13.2 (+1.1/-1.3) citations

Papers with abstracts written in passive voice are slightly more likely to have below-median citation rates.

Given the best-fit linear median model for each sub-arxiv, I can determine if any paper falls above its predicted median citation rate or below it (given the number of unique word roots in its abstract). Controlling for the abstract length in this way, I re-inspected the other abstract properties to see if any others had any second-order influence on the citation rate. I found that papers written largely in passive voice were more likely to fall below their predicted median citation rate (given their abstract length) than papers written largely in active voice. This "passive voice penalty" is roughly a 10% effect.

Penalty for passive voice

Figure 2: Fraction of papers with citations above their predicted median citation rate, given their abstract length, as a function of the fraction of their abstracts' sentences that are written in active voice, illustrated in five equal-population groups. 1-sigma sampling uncertainty illustrated by cyan regions.

Some individual words appear more often in highly-cited papers' abstracts 

I searched for words that appeared in multiple abstracts, and for each word counted the number of abstracts that contained that word which had more than the median citation count for abstracts of that length, and the number with fewer citations. I treated these two numbers as the outcome of a binomial process and assessed the likelihood that each word's pair of "highly cited" (>median) and "poorly cited" (<median) outcomes was consistent with chance given fair odds. Because I was checking many (N) unique words, each with different rates of occurrence across the sample of abstracts, I had to correct this estimate of statistical significance for the number of trials I performed. I achieved this with many Monte Carlo simulations of N fair (p=0.5) binomial processes with the same distribution of occurrence rates as the real words, and determined the probability of a given binomial test significance appearing for one word out of the sample of size N (assuming that all words are fair). I adopted this probability as the likelihood that a given word is "fair" (the null hypothesis). 

There are several words for some sub-arXivs that are very likely not fair. Instead, papers with abstracts that contain these words are statistically significantly more likely to have higher-than-median citation rates compared to abstracts that do not.

These positively-biased words are listed for each sub-arxiv below.

For astro-ph (general):

    WordpN above median citationsN equal median citationsN below median citations
    abridged less than 0.1% 60 3 12
    galax- 0.1% 286 8 182
    lcdm 0.2% 23 1 1
    massive 4% 123 3 66
    scale 5% 224 9 146

    For astro-ph.HE:

    WordpN above median citationsN equal median citationsN below median citations
    "100" 1% 39 0 10
    GeV 5% 53 0 23

    For astro-ph.EP:

    WordpN above median citationsN equal median citationsN below median citations
    star 5% 36 2 11

    I identified no words that were negatively biased to a statistically significant degree.

    The fact that the word "abridged" appears far more frequently in highly-cited abstracts than it does in poorly cited ones is a nice independent confirmation that long, detailed abstracts are generally better-cited than shorter ones.

    Summary

    All of the work above illustrates strong correlations between properties of paper abstracts and their median citation rates after five years. However, the causative link is not clear. It could well be that long, detailed abstracts written in active voice are generally linked to detailed, well-written papers, and that writing a long, detailed, active-voice abstract would do nothing to help an otherwise poor paper.

    That being said, I can think of no reason to encourage authors to write short or repetitive abstracts entirely in the passive voice.

    Site content copyright Alex H. Parker, 2009-2021.